Distribution
Hutch ships in three layers. Pick the one that matches your effort budget; they all write to the same canonical event store, and the dashboard treats events from any layer identically.
| Layer | Surface | Coverage | Time to first dashboard |
|---|---|---|---|
| 1. Importer / watcher | hutch import <path> or hutch watch <path> (eleven built-in adapters plus an LLM fallback) |
Every system | Seconds |
| 2. Skill | Drop SKILL.md into your agent's instructions |
Any LLM-driven loop | One agent restart |
| 3. SDK | import hutch as h; h.log_*(...) |
Any Python loop you control | Hours |
flowchart LR
    L1["<b>Layer 1</b><br/>hutch import / watch"]
    L2["<b>Layer 2</b><br/>Agent + SKILL.md"]
    L3["<b>Layer 3</b><br/>Python SDK"]

    D[("Daemon<br/>:7777")]
    DB[("DuckDB")]
    UI["Dashboard<br/>browser"]

    OT["OpenTelemetry<br/>collector"]
    OL["OpenLineage<br/>backend"]

    L1 -->|events| D
    L2 -->|events| D
    L3 -->|events| D
    D --> DB
    DB --> UI

    L3 -.optional.-> OT
    L3 -.optional.-> OL

    classDef opt fill:#fafafa,stroke:#bbb,color:#666;
    class OT,OL opt;
Whichever layer you use, the dashboard you get looks the same:
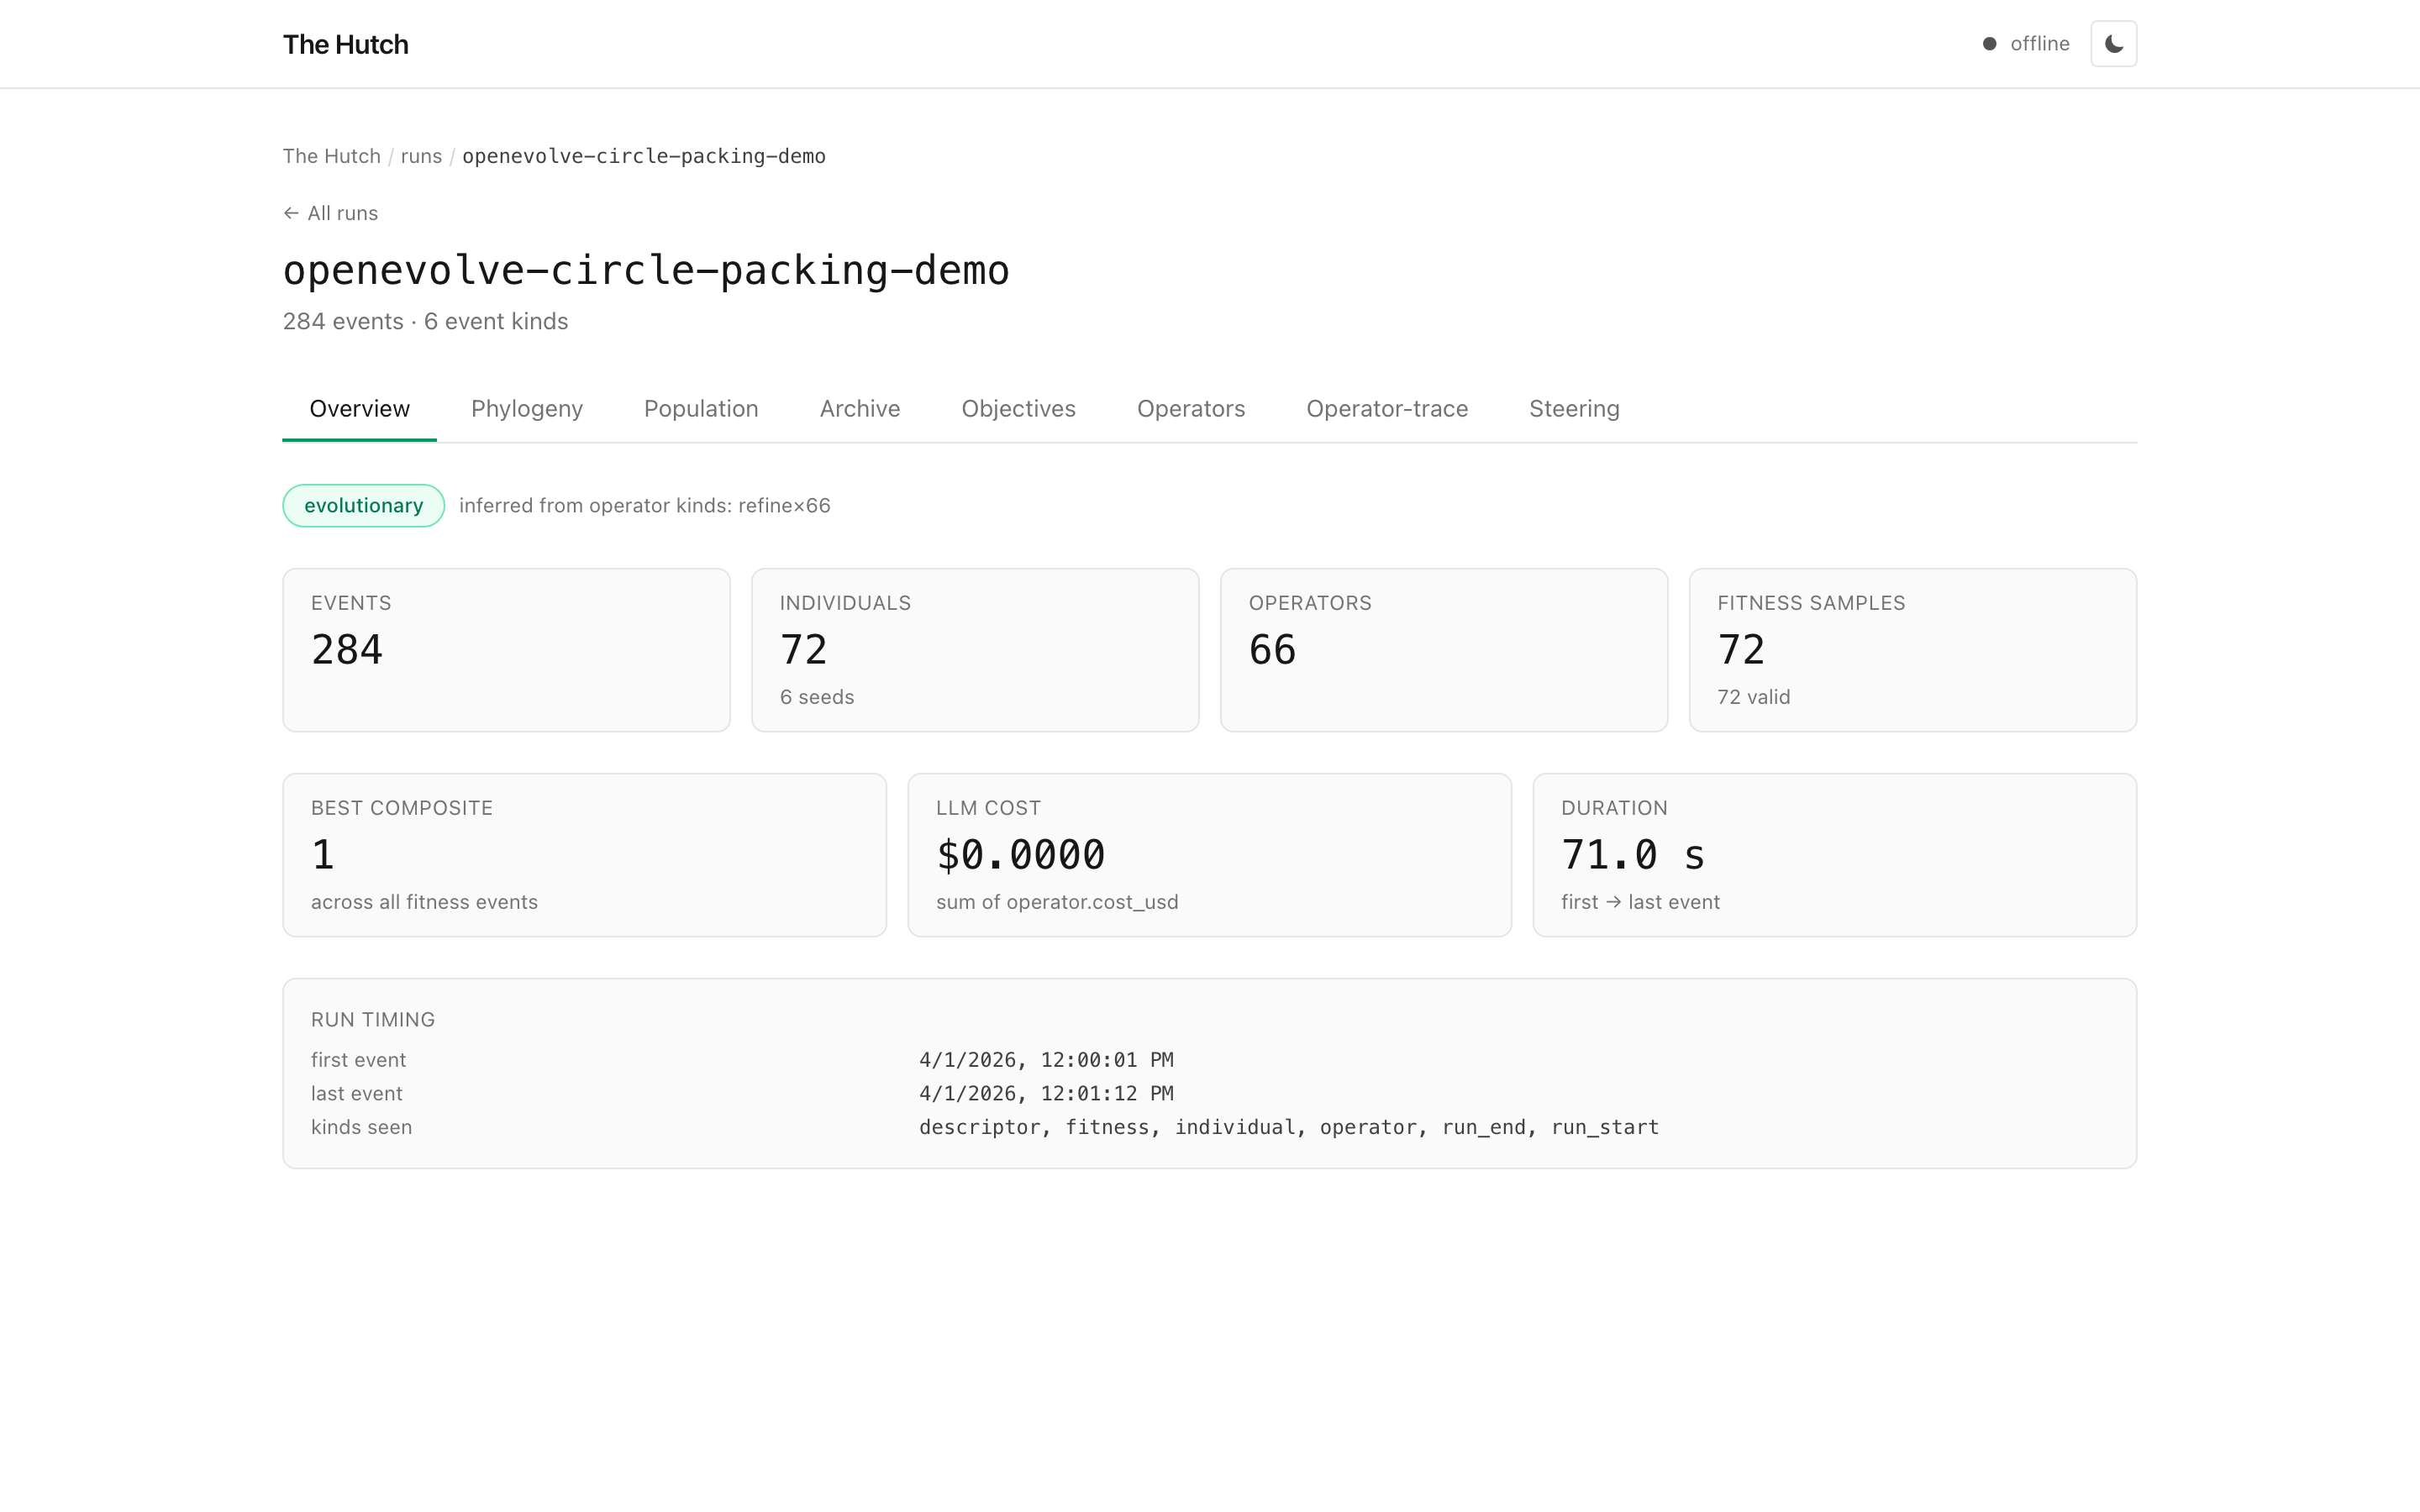 The Overview tab for an OpenEvolve circle-packing run: 284 events
across 6 event kinds, broken down into top-line counters (individuals,
operators, fitness samples) plus run timing.
The Overview tab for an OpenEvolve circle-packing run: 284 events
across 6 event kinds, broken down into top-line counters (individuals,
operators, fitness samples) plus run timing.
Most users start at Layer 1 and move down only when they need the
extra resolution. A user who never goes past hutch import already gets
the full dashboard.
Layer 1: importer
pip install thehutch
hutch serve &                   # localhost:7777
hutch import ./checkpoint       # auto-detects from the registry
hutch watch ./checkpoint        # poll the same adapter live
Eleven systems have built-in adapters in v0.1.1: OpenEvolve, AIDE, DGM, QDax, ASI-ARCH, FunSearch, CORAL, POET, CVEvolve, ptychi-evolve, and ShinkaEvolve. See Adapters for the format each one expects.
hutch import remains batch mode. hutch watch <path> and
hutch import --watch <path> repeatedly poll the adapter source, write
only new deterministic event IDs, mark the run as running through
run_update, and emit run_end when explicit or idle completion is
detected.
The dashboard is intentionally sparse. Cards and tabs appear only when
the event log supports them, either through explicit run capabilities
(steering, llm_usage, live_updates, audit) or conservative
inference from observed events. A logged zero is shown as zero; missing
data is treated as not logged or unsupported.
For anything else, the LLM-assisted importer reads a file or directory
of unknown records, asks an LLM to write a to_canonical(record)
adapter, validates the output in a constrained subprocess on a held-out
sample, and reports coverage:
hutch import ./novel-format --llm
# loads .env if present (OPENAI_API_KEY or ANTHROPIC_API_KEY)
# detects → generates → validates → caches → emits
# coverage: 96 events written; sample 12/12 (100%) full 96/96 (100%)
Generated adapters are cached at
~/.hutch/adapters/<prompt-fingerprint>.json, so importing the same
format a second time hits the cache instead of calling the LLM. The
validation subprocess is defense in depth, not a kernel sandbox; the
trust boundary is documented in security.md.
Layer 2: skill
hutch-skill/SKILL.md is the deliverable that makes Hutch's write side
work for an LLM-driven agent. Drop it into your agent's instruction
surface (a .claude/skills/hutch/SKILL.md file, the system prompt of a
custom GPT, your Cursor rules, and so on). The agent then learns the
canonical event vocabulary plus the steering-poll protocol.
The skill instructs the agent to either:
- import
hutchand callh.log_individual,h.log_fitness,h.log_operator, etc., or - POST canonical JSON to
http://localhost:7777/eventsif it has no Python dependency.
Five worked examples in hutch-skill/examples/ cover the full event
vocabulary across linear, evolutionary, self-improving, tree-search, and
quality-diversity loops. The most important behavior the skill teaches
is to poll the steering channel between iterations; see
Steering for what that buys you.
Layer 3: SDK
import hutch as h

h.start_run(name="circle-packing", project="research")
seed = h.log_individual(kind="program")
h.log_fitness(individual=seed, scores={"sum_radii": 2.63})
h.end_run()
The SDK has two transports:
- Daemon mode (default). The SDK posts events to
http://localhost:7777/events. Configure withHUTCH_DAEMON_URLorhutch.configure(SDKConfig(mode="daemon", daemon_url=...)). - Embedded mode. The SDK writes directly to a local DuckDB file.
Useful in CI, notebooks, and single-script runs. Activate with
HUTCH_DB_PATH=/tmp/hutch.duckdborSDKConfig(mode="embedded", db_path=...).
The default is non-strict: transient transport failures get queued to a
fallback JSONL on disk and replayed when the daemon comes back. SDK
calls do not raise on capture failures, because a research loop should
not crash because telemetry is down. Set HUTCH_STRICT=1 to opt into
raising.
Optional OpenTelemetry emitter
The SDK can additionally emit OpenTelemetry spans on the research.*
namespace, alongside the regular daemon or embedded transport. Set
HUTCH_OTEL_ENDPOINT to enable it, and install the [otel] extra
(pip install thehutch[otel]). See otel.md.
Optional OpenLineage emitter
The SDK can also POST OpenLineage RunEvents to a Marquez,
OpenMetadata, or DataHub backend. Set HUTCH_OPENLINEAGE_ENDPOINT to
enable it. No extra install is needed: the emitter speaks OL 2.0 JSON
over HTTP directly. It composes with the OTel emitter; you can enable
both. See openlineage.md.
Publication exports
Three offline serializers for finished runs: hutch export ara for a
self-contained tarball that round-trips, hutch export prov for W3C
PROV-O, and hutch export ro-crate for a Workflow Run RO-Crate. All
three read from the same canonical event log. Only the alternate PROV-O
serializations (JSON-LD, N-Triples, RDF-XML) need an extra
(pip install thehutch[publish]); Turtle works without one. See
publication.md.
Choosing a layer
| Situation | Use |
|---|---|
| You inherited a checkpoint dir from someone else | Layer 1 |
| You're building a new agent that runs through Claude or GPT | Layer 2 |
| You're writing a Python loop you control | Layer 3 |
| You want long-term observability for a production system | Layer 3 plus OTel |
You can mix freely. The daemon ingests events from any layer and the dashboard treats them uniformly.